Latent Component Gaussian Process (LCGP): replicated 1D illustration#

The experiment compares LCGP behavior under three replication designs and two training modes:

Axis

Options

Replication design

uniform, skewed, hotspot

Training mode

replicated-data reduction (rep) and full-data training (full)

Figure type

output predictions (y) and latent GP diagnostics (g)

The notebook is deterministic: each (case, submethod) run receives its own fixed random seed.

Execution requirements#

This page expects the following packages to already be available in the JupyterBook build environment or to be installed during runtime:

  lcgp
  pandas
  matplotlib
  tensorflow-probability[tf]
  pytest

Imports and global configuration#

Hide code cell source

from __future__ import annotations

import time
from dataclasses import dataclass
from pathlib import Path

import numpy as np
import pandas as pd
import matplotlib.pyplot as plt
from matplotlib.ticker import FuncFormatter
from IPython.display import Markdown, display

from call_model import LCGPRun
from lcgp import evaluation

pd.options.display.html.border = 1

plt.rcParams.update({
    "figure.dpi": 110,
    "savefig.dpi": 150,
    "axes.grid": False,
})

def add_faint_vertical_grid(ax):
    """Add subtle vertical grid lines for easier x-axis reading."""
    ax.grid(axis="x", which="major", alpha=0.18, linewidth=0.6)
    ax.grid(axis="x", which="minor", alpha=0.08, linewidth=0.4)
    return ax

def format_at_most_2_decimals(value):
    """Format numeric display values with at most two decimal places."""
    if isinstance(value, (float, np.floating)):
        if not np.isfinite(value):
            return str(value)
        return f"{value:.2f}".rstrip("0").rstrip(".")
    return value


def format_nested_for_display(value):
    """Format scalars and nested arrays/lists for notebook display only."""
    if isinstance(value, (float, np.floating)):
        return format_at_most_2_decimals(value)
    if isinstance(value, np.ndarray):
        return format_nested_for_display(value.tolist())
    if isinstance(value, (list, tuple)):
        return "[" + ", ".join(str(format_nested_for_display(v)) for v in value) + "]"
    return value


def display_table(df: pd.DataFrame):
    """Display a DataFrame with all numeric values shown to at most two decimals."""
    return display(
        df.style
        .hide(axis="index")
        .format(format_nested_for_display)
    )


TWO_DECIMAL_AXIS_FORMATTER = FuncFormatter(
    lambda value, pos: format_at_most_2_decimals(value)
)

pd.options.display.float_format = format_at_most_2_decimals
WARNING: All log messages before absl::InitializeLog() is called are written to STDERR
I0000 00:00:1783219055.144210     672 cudart_stub.cc:31] Could not find cuda drivers on your machine, GPU will not be used.
WARNING: All log messages before absl::InitializeLog() is called are written to STDERR
I0000 00:00:1783219056.715761     672 cudart_stub.cc:31] Could not find cuda drivers on your machine, GPU will not be used.
# All options executed by this JupyterBook page.
CASES = (1, 2, 3)
SUBMETHODS = ("rep", "full")
PLOT_MODES = ("y", "g")

BASE_SEED = 42
RESULTS_ROOT = Path("results_figure_jupyterbook")
RESULTS_ROOT.mkdir(parents=True, exist_ok=True)

CASE_LABELS = {
    1: "Uniform replication",
    2: "Uneven replication",
    3: "Hotspot replication at selected x",
}

True function#

The input is one-dimensional, $x \in [0,1]$, while the response has three output dimensions:

$$y(x) = \begin{bmatrix} f_1(x) \ f_2(x) \ f_3(x) \end{bmatrix}.$$

The three outputs share the same scalar input but have different shapes. This gives a compact multi-output regression problem where replication can affect both mean estimation and uncertainty quantification.

Hide code cell source

def f_true(x: np.ndarray) -> np.ndarray:
    """Three-output ground-truth function evaluated at a one-dimensional input."""
    x = np.asarray(x, dtype=np.float64)
    f1 = 0.8 + 0.3 * np.sin(2 * np.pi * x) + 0.2 * x
    f2 = 0.3 + 0.5 * np.cos(2 * np.pi * x)
    f3 = -0.4 - (x - 0.5) ** 2 + 0.2 * np.sin(4 * np.pi * x)
    return np.vstack([f1, f2, f3])

Replicated data generators#

Hide code cell source

def make_rep_data(
    n_unique: int = 12,
    rep_choices: tuple[int, ...] = (1, 2, 3, 4),
    noise_std: tuple[float, float, float] = (0.05, 0.08, 0.10),
    rng: np.random.Generator | None = None,
) -> tuple[np.ndarray, np.ndarray, np.ndarray, np.ndarray]:
    """Case 1: roughly uniform replication over the input domain."""
    rng = np.random.default_rng(BASE_SEED) if rng is None else rng
    x_unique = np.linspace(0.0, 1.0, n_unique, dtype=np.float64)
    r = rng.choice(rep_choices, size=n_unique, replace=True)

    xs, ys = [], []
    for i, xi in enumerate(x_unique):
        yi_true = f_true(np.array([xi]))[:, 0]
        for _ in range(int(r[i])):
            eps = rng.normal(0, noise_std, size=3).astype(np.float64)
            xs.append([xi])
            ys.append(yi_true + eps)

    xtrain = np.asarray(xs, dtype=np.float64)
    ytrain = np.asarray(ys, dtype=np.float64).T
    xtest = np.linspace(0.0, 1.0, 400, dtype=np.float64)[:, None]
    ytrue = f_true(xtest[:, 0])
    return xtrain, ytrain, xtest, ytrue


def make_rep_data_skewed(
    n_unique: int = 40,
    heavy_region: tuple[float, float] = (0.20, 0.45),
    light_rep_choices: tuple[int, ...] = (1, 2),
    heavy_rep_choices: tuple[int, ...] = (8, 12, 16, 20),
    noise_std: tuple[float, float, float] = (0.05, 0.08, 0.10),
    rng: np.random.Generator | None = None,
) -> tuple[np.ndarray, np.ndarray, np.ndarray, np.ndarray]:
    """Case 2: many replicates in a contiguous subregion."""
    rng = np.random.default_rng(BASE_SEED) if rng is None else rng
    x_unique = np.linspace(0.0, 1.0, n_unique, dtype=np.float64)

    xs, ys = [], []
    for xi in x_unique:
        choices = heavy_rep_choices if heavy_region[0] <= xi <= heavy_region[1] else light_rep_choices
        reps = int(rng.choice(choices))
        yi_base = f_true(np.array([xi]))[:, 0]
        for _ in range(reps):
            eps = np.asarray([rng.normal(0, s) for s in noise_std], dtype=np.float64)
            xs.append([xi])
            ys.append(yi_base + eps)

    xtrain = np.asarray(xs, dtype=np.float64)
    ytrain = np.asarray(ys, dtype=np.float64).T
    xtest = np.linspace(0.0, 1.0, 400, dtype=np.float64)[:, None]
    ytrue = f_true(xtest[:, 0])
    return xtrain, ytrain, xtest, ytrue


def make_rep_data_hotspots(
    n_unique: int = 50,
    hotspots: tuple[tuple[float, int, int], ...] = ((0.15, 10, 15), (0.50, 18, 25), (0.80, 12, 20)),
    base_rep_choices: tuple[int, ...] = (1,),
    noise_std: tuple[float, float, float] = (0.05, 0.08, 0.10),
    rng: np.random.Generator | None = None,
) -> tuple[np.ndarray, np.ndarray, np.ndarray, np.ndarray]:
    """Case 3: very high replication at selected hotspot locations."""
    rng = np.random.default_rng(BASE_SEED) if rng is None else rng
    x_unique = np.linspace(0.0, 1.0, n_unique, dtype=np.float64)
    hotspot_idx = {
        int(np.argmin(np.abs(x_unique - x0))): (lo, hi)
        for (x0, lo, hi) in hotspots
    }

    xs, ys = [], []
    for i, xi in enumerate(x_unique):
        if i in hotspot_idx:
            lo, hi = hotspot_idx[i]
            reps = int(rng.integers(lo, hi + 1))
        else:
            reps = int(rng.choice(base_rep_choices))

        yi_base = f_true(np.array([xi]))[:, 0]
        for _ in range(reps):
            eps = np.asarray([rng.normal(0, s) for s in noise_std], dtype=np.float64)
            xs.append([xi])
            ys.append(yi_base + eps)

    xtrain = np.asarray(xs, dtype=np.float64)
    ytrain = np.asarray(ys, dtype=np.float64).T
    xtest = np.linspace(0.0, 1.0, 400, dtype=np.float64)[:, None]
    ytrue = f_true(xtest[:, 0])
    return xtrain, ytrain, xtest, ytrue

Hide code cell source

# Experiment helper functions
@dataclass(frozen=True)
class ReplicationSummary:
    case: int
    submethod: str
    n_total: int
    n_unique: int
    rep_min: int
    rep_mean: float
    rep_max: int
    seed: int


def build_dataset(case: int, seed: int) -> tuple[np.ndarray, np.ndarray, np.ndarray, np.ndarray]:
    """Generate one replicated dataset for the requested case."""
    rng = np.random.default_rng(seed)

    if case == 1:
        return make_rep_data(
            n_unique=16,
            rep_choices=(1, 2, 3, 4, 5),
            noise_std=(0.05, 0.08, 0.10),
            rng=rng,
        )

    if case == 2:
        return make_rep_data_skewed(
            n_unique=40,
            heavy_region=(0.20, 0.45),
            light_rep_choices=(1, 2),
            heavy_rep_choices=(8, 12, 16, 20),
            noise_std=(0.05, 0.08, 0.10),
            rng=rng,
        )

    if case == 3:
        return make_rep_data_hotspots(
            n_unique=50,
            hotspots=((0.15, 10, 15), (0.50, 18, 25), (0.80, 12, 20)),
            base_rep_choices=(1,),
            noise_std=(0.05, 0.08, 0.10),
            rng=rng,
        )

    raise ValueError("case must be one of 1, 2, or 3")


def summarize_replication(case: int, submethod: str, xtrain: np.ndarray, seed: int) -> ReplicationSummary:
    _, rep_counts = np.unique(xtrain[:, 0], return_counts=True)
    return ReplicationSummary(
        case=case,
        submethod=submethod,
        n_total=int(xtrain.shape[0]),
        n_unique=int(rep_counts.size),
        rep_min=int(rep_counts.min()),
        rep_mean=float(rep_counts.mean()),
        rep_max=int(rep_counts.max()),
        seed=seed,
    )


def fit_lcgp(
    xtrain: np.ndarray,
    ytrain: np.ndarray,
    xtest: np.ndarray,
    ytrue: np.ndarray,
    submethod: str,
    runno: str,
):
    """Fit an LCGP model and return the run object, predictions, and elapsed training time."""
    data = {
        "xtrain": xtrain,
        "xtest": xtest,
        "ytrain": ytrain,
        "ytest": ytrue,
        "ytrue": ytrue,
    }

    modelrun = LCGPRun(
        runno=runno,
        data=data,
        num_latent=3,
        var_threshold=None,
        submethod=submethod,
        diag_error_structure=[1, 1, 1],
        robust_mean=True,
    )
    modelrun.define_model()

    t0 = time.time()
    modelrun.train()
    elapsed = time.time() - t0

    predmean, ypredvar, yconfvar = modelrun.predict(return_fullcov=False)
    return modelrun, predmean, ypredvar, yconfvar, elapsed


def evaluate_prediction(ytrue: np.ndarray, predmean: np.ndarray, yconfvar: np.ndarray) -> dict[str, float]:
    """Compute scalar prediction-quality metrics for the fitted model."""
    pcover, pwidth = evaluation.intervalstats(ytrue, predmean, yconfvar)
    return {
        "RMSE": float(evaluation.rmse(ytrue, predmean)),
        "NRMSE": float(evaluation.normalized_rmse(ytrue, predmean)),
        "95% PI coverage": float(pcover),
        "95% PI width": float(pwidth),
        "DSS": float(evaluation.dss(ytrue, predmean, yconfvar, use_diag=True)),
    }

Hide code cell source

## Plotting helper functions
def plot_output_predictions(
    case: int,
    submethod: str,
    xtrain: np.ndarray,
    ytrain: np.ndarray,
    xtest: np.ndarray,
    ytrue: np.ndarray,
    predmean: np.ndarray,
    yconfvar: np.ndarray,
    outfile: Path | None = None,
):
    """Plot observed replicates, true functions, posterior means, and 95% confidence bands."""
    order_test = np.argsort(xtest[:, 0])
    order_train = np.argsort(xtrain[:, 0])

    fig, axes = plt.subplots(3, 1, figsize=(10, 7), sharex=True)
    for i, ax in enumerate(axes):
        ax.scatter(
            xtrain[order_train, 0],
            ytrain[i, order_train],
            s=12,
            alpha=0.65,
            label="replicates" if i == 0 else None,
        )
        ax.plot(
            xtest[order_test, 0],
            ytrue[i, order_test],
            lw=1.8,
            label="true" if i == 0 else None,
        )
        ax.plot(
            xtest[order_test, 0],
            predmean[i, order_test],
            lw=1.5,
            label="LCGP mean" if i == 0 else None,
        )

        lo = predmean[i, order_test] - 1.96 * np.sqrt(yconfvar[i, order_test])
        hi = predmean[i, order_test] + 1.96 * np.sqrt(yconfvar[i, order_test])
        ax.fill_between(
            xtest[order_test, 0],
            lo,
            hi,
            alpha=0.22,
            label="95% credible band" if i == 0 else None,
        )
        ax.set_ylabel(fr"$f_{i + 1}(x)$")
        ax.xaxis.set_major_formatter(TWO_DECIMAL_AXIS_FORMATTER)
        ax.yaxis.set_major_formatter(TWO_DECIMAL_AXIS_FORMATTER)
        ax.minorticks_on()
        add_faint_vertical_grid(ax)

    axes[-1].set_xlabel("x")
    axes[0].legend(loc="best", fontsize=9)
    fig.suptitle(f"LCGP predictions - Case {case}: {CASE_LABELS[case]} ({submethod})", y=1.01)
    fig.tight_layout()

    if outfile is not None:
        fig.savefig(outfile, bbox_inches="tight")

    return fig


def plot_latent_gps(
    case: int,
    submethod: str,
    modelrun,
    xtest: np.ndarray,
    outfile: Path | None = None,
):
    """Plot latent GP posterior means and 95% bands."""
    mdl = modelrun.model
    _ = mdl.predict(x0=xtest, return_fullcov=False)

    ghat_test = np.asarray(mdl.ghat)
    gstd_test = np.sqrt(np.asarray(mdl.gvar))
    ghat_train = np.asarray(mdl.mks)
    if mdl.submethod == 'rep':
        x_train_unique = np.asarray(mdl.x_unique)
    elif mdl.submethod == 'full':
        x_train_unique = np.asarray(mdl.x)
    else:
        raise ValueError("Invalid submethod. Choose 'full' or 'rep'")

    order_test = np.argsort(xtest[:, 0])
    order_unique = np.argsort(x_train_unique[:, 0])

    q = ghat_test.shape[0]
    fig, axes = plt.subplots(q, 1, figsize=(10, 1.9 * q), sharex=True)
    if q == 1:
        axes = [axes]

    x_test_sorted = xtest[order_test, 0]
    x_train_sorted = x_train_unique[order_unique, 0]

    for k, ax in enumerate(axes):
        mean = ghat_test[k, order_test]
        sd = gstd_test[k, order_test]
        ax.plot(x_test_sorted, mean, lw=1.8, label=fr"$g_{{{k + 1}}}(x)$ mean")
        ax.fill_between(x_test_sorted, mean - 1.96 * sd, mean + 1.96 * sd, alpha=0.22, label="95% band")
        ax.scatter(x_train_sorted, ghat_train[k, order_unique], s=12, alpha=0.65, label="train points")
        ax.set_ylabel(fr"$g_{{{k + 1}}}(x)$")
        ax.xaxis.set_major_formatter(TWO_DECIMAL_AXIS_FORMATTER)
        ax.yaxis.set_major_formatter(TWO_DECIMAL_AXIS_FORMATTER)
        ax.minorticks_on()
        add_faint_vertical_grid(ax)
        ax.legend(loc="best", fontsize=9)

    axes[-1].set_xlabel("x")
    fig.suptitle(f"Latent GPs — Case {case}: {CASE_LABELS[case]} ({submethod})", y=1.01)
    fig.tight_layout()

    if outfile is not None:
        fig.savefig(outfile, bbox_inches="tight")

    return fig

Comparing multiple scenarios of replications#

summary_rows: list[dict] = []
metric_rows: list[dict] = []
diagnostic_rows: list[dict] = []

for case in CASES:
    for submethod in SUBMETHODS:
        seed = BASE_SEED + 100 * case + (0 if submethod == "rep" else 1)
        xtrain, ytrain, xtest, ytrue = build_dataset(case, seed=seed)

        rep_summary = summarize_replication(case, submethod, xtrain, seed)
        summary_rows.append({
            "case": rep_summary.case,
            "case label": CASE_LABELS[case],
            "submethod": rep_summary.submethod,
            "N total": rep_summary.n_total,
            "unique x": rep_summary.n_unique,
            "rep min": rep_summary.rep_min,
            "rep mean": rep_summary.rep_mean,
            "rep max": rep_summary.rep_max,
            "seed": rep_summary.seed,
        })

        display(Markdown(f"### Case {case}: {CASE_LABELS[case]} — `{submethod}`"))
        summary_rows_df = pd.DataFrame([summary_rows[-1]])
        display_table(summary_rows_df)

        modelrun, predmean, ypredvar, yconfvar, elapsed = fit_lcgp(
            xtrain=xtrain,
            ytrain=ytrain,
            xtest=xtest,
            ytrue=ytrue,
            submethod=submethod,
            runno=f"case_{case}_{submethod}",
        )

        metrics = evaluate_prediction(ytrue, predmean, yconfvar)
        metric_rows.append({
            "case": case,
            "case label": CASE_LABELS[case],
            "submethod": submethod,
            "training time (s)": elapsed,
            **metrics,
        })
        metric_rows_df = pd.DataFrame([metric_rows[-1]])
        display_table(metric_rows_df)

        mdl = modelrun.model
        lLmb, lLmb0, lsigma2s, lnugGPs = mdl.get_param()
        if mdl.submethod == 'rep':
            r = np.asarray(mdl.r.numpy())
        elif mdl.submethod == 'full':
            r = np.array([1.])

        diagnostic_rows.append({
            "case": case,
            "case label": CASE_LABELS[case],
            "submethod": submethod,
            # "diag_D": np.asarray(mdl.diag_D.numpy()).round(2).tolist(),
            # "phi^T phi diag": np.diag(mdl.phi.numpy().T @ mdl.phi.numpy()).round(2).tolist(),
            "lengthscales": [np.asarray(lLmb[k].numpy()).round(2).tolist() for k in range(lLmb.shape[0])],
            "noise std fitted": np.sqrt(np.exp(lsigma2s.numpy())).round(2).tolist(),
            # "rep avg/min/max": f"{np.mean(r):.1f} / {np.min(r)} / {np.max(r)}",
        })
        diagnostic_rows_df = pd.DataFrame([diagnostic_rows[-1]])
        display_table(diagnostic_rows_df)

        run_dir = RESULTS_ROOT / f"case_{case}_{submethod}"
        run_dir.mkdir(parents=True, exist_ok=True)

        fig_y = plot_output_predictions(
            case=case,
            submethod=submethod,
            xtrain=xtrain,
            ytrain=ytrain,
            xtest=xtest,
            ytrue=ytrue,
            predmean=predmean,
            yconfvar=yconfvar,
            outfile=run_dir / "lcgp_output.png",
        )
        plt.show()

        fig_g = plot_latent_gps(
            case=case,
            submethod=submethod,
            modelrun=modelrun,
            xtest=xtest,
            outfile=run_dir / "lcgp_latent.png",
        )
        plt.show()

        display(Markdown(f"Saved figures to `{run_dir.as_posix()}/`."))

Case 1: Uniform replication — rep

case case label submethod N total unique x rep min rep mean rep max seed
1 Uniform replication rep 41 16 1 2.56 5 142
======= VARIANCE OF G ======
tf.Tensor([0.99256334 0.99888453 0.93669309], shape=(3,), dtype=float64)
case case label submethod training time (s) RMSE NRMSE 95% PI coverage 95% PI width DSS
1 Uniform replication rep 5.19 0.04 0.07 1 0.23 -15.61
case case label submethod lengthscales noise std fitted
1 Uniform replication rep [[0.13], [0.21], [0.09]] [0, 0.01, 0]
_images/1764f6e3e434e427b9cafaf4cdf18b11a3f00e36d0fdf3ec85d09e15b2493f68.png _images/450b28ba60e106ec01b287e58e483c0b6ad008fd9734d8273789716966008039.png

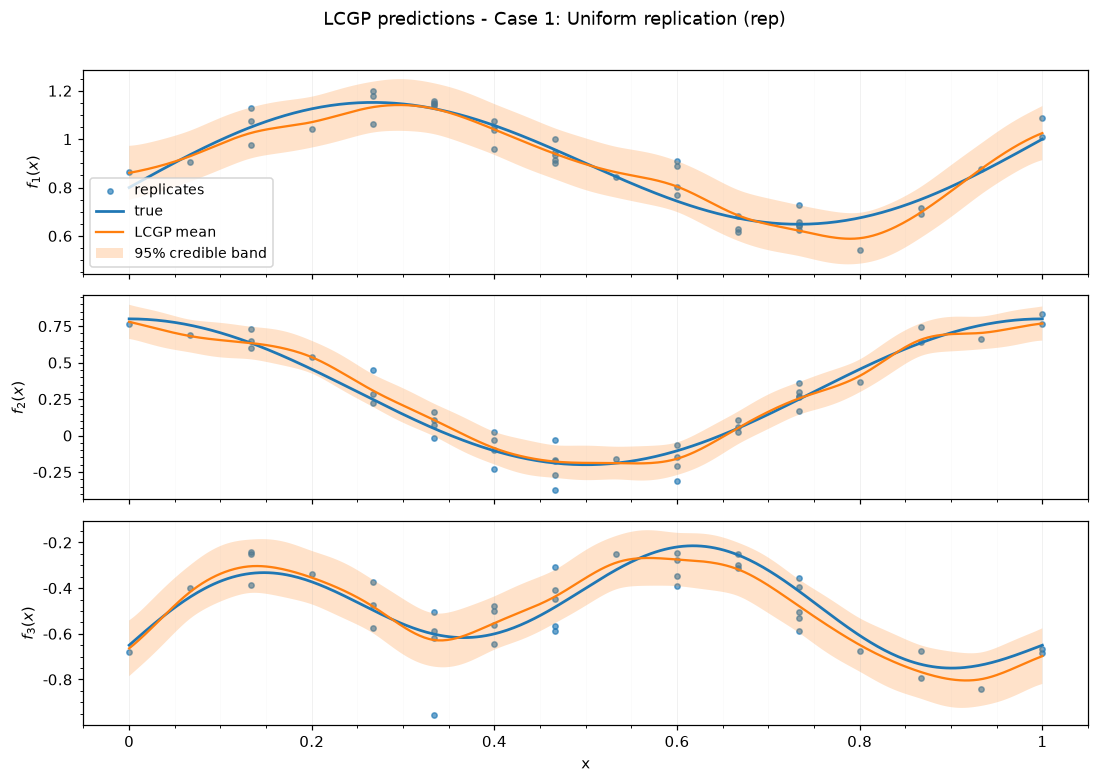
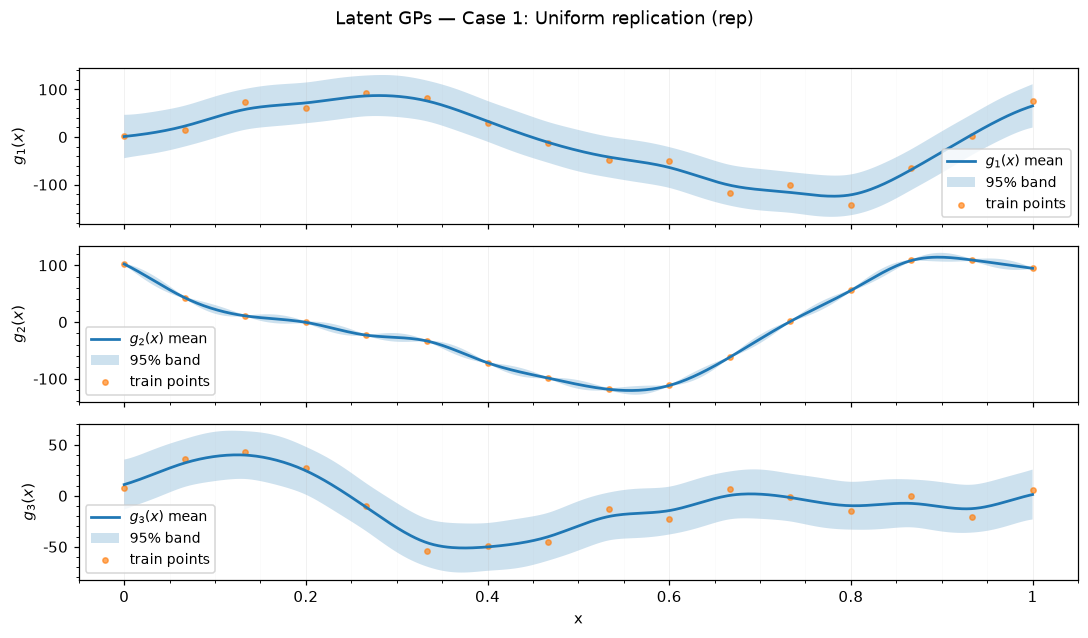
Saved figures to results_figure_jupyterbook/case_1_rep/.

Case 1: Uniform replication — full

case case label submethod N total unique x rep min rep mean rep max seed
1 Uniform replication full 51 16 1 3.19 5 143
======= VARIANCE OF G ======
tf.Tensor([0.97259295 0.96453525 0.99985276], shape=(3,), dtype=float64)
case case label submethod training time (s) RMSE NRMSE 95% PI coverage 95% PI width DSS
1 Uniform replication full 3.01 0.03 0.06 0.97 0.18 -16.95
case case label submethod lengthscales noise std fitted
1 Uniform replication full [[0.18], [0.21], [0.18]] [0.27, 0.22, 0.82]
_images/7ffd86305fff94346c2b442781cb7490507d92adf1569151085b375a01da4c9c.png _images/7eb61ee39902f3edfcd0739fd9de74e88086061206ab834ed18dc322c9b19fcd.png

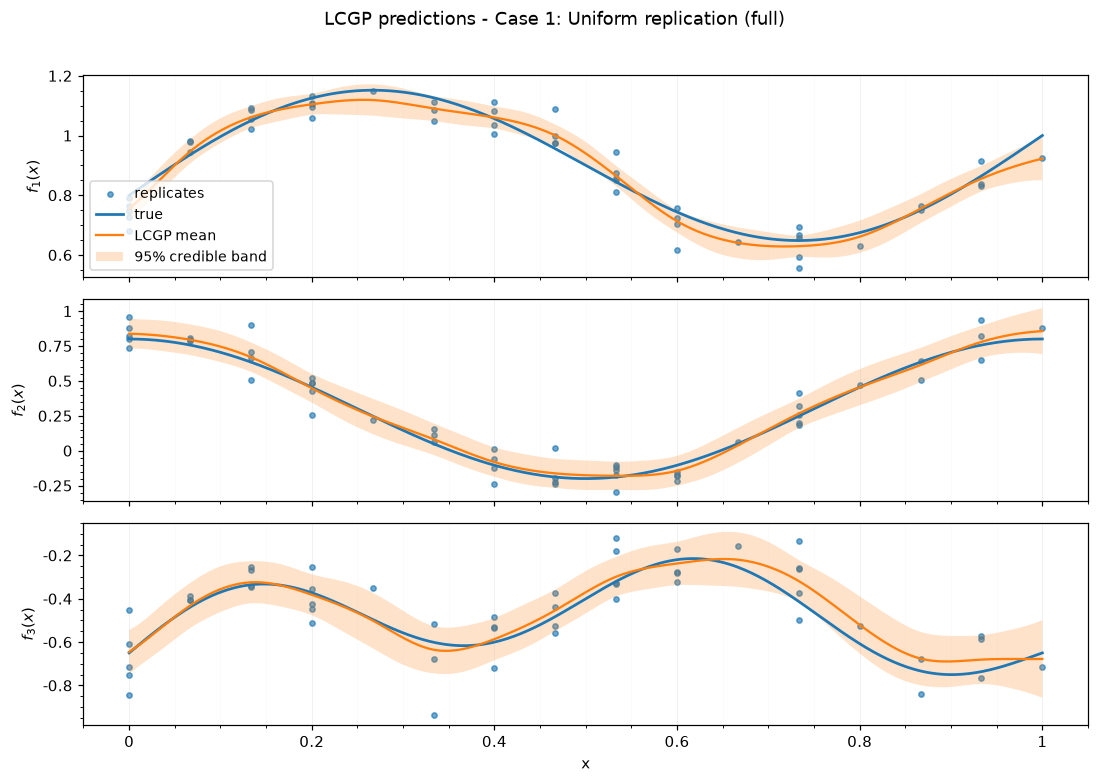
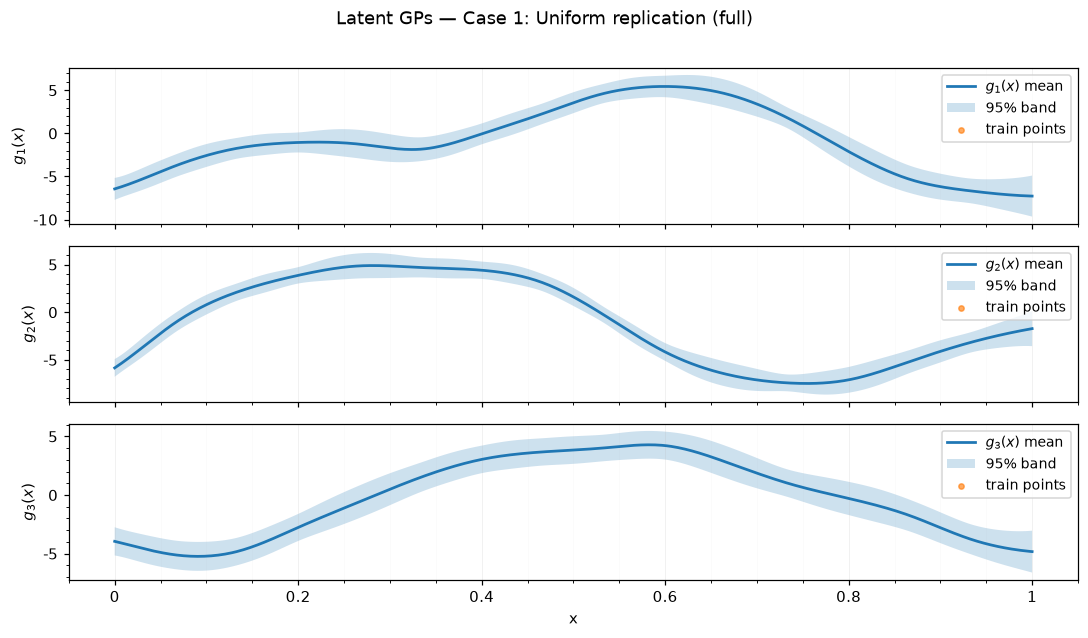
Saved figures to results_figure_jupyterbook/case_1_full/.

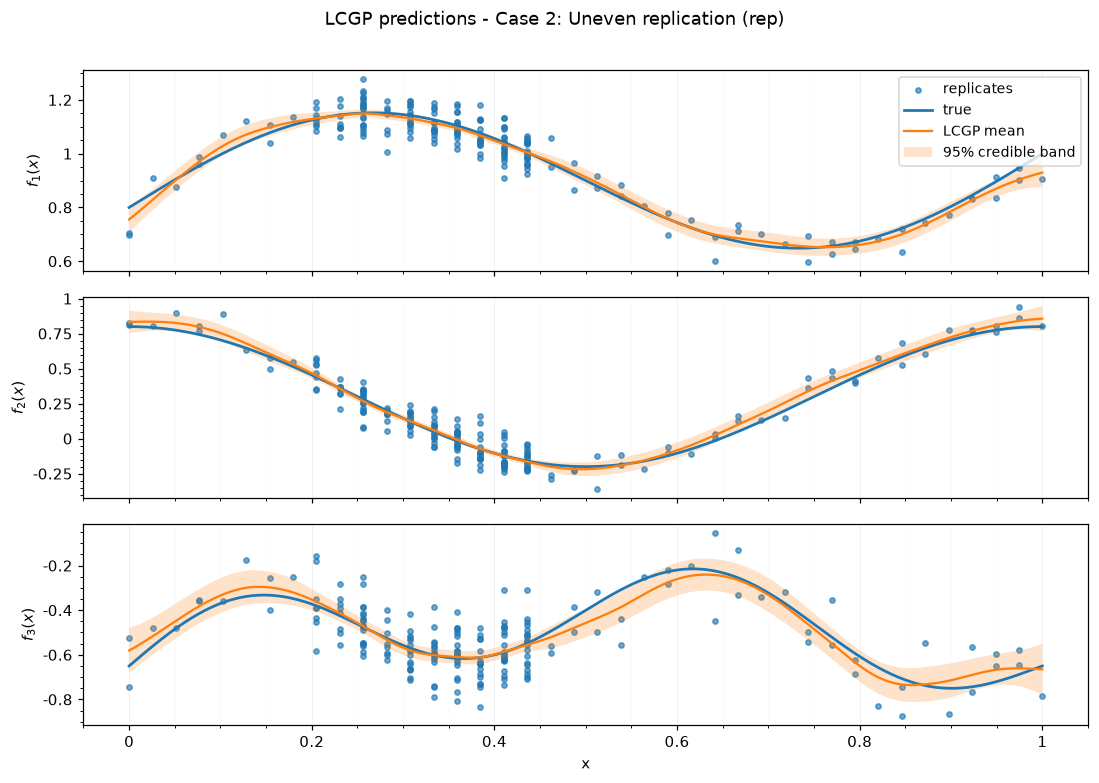
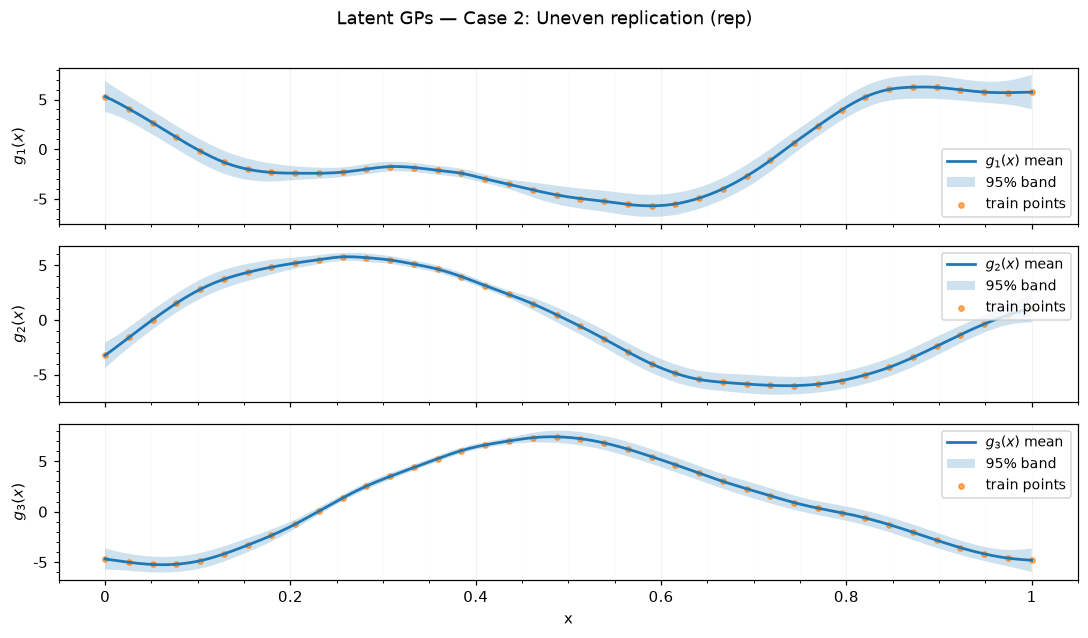
Case 2: Uneven replication — rep

case case label submethod N total unique x rep min rep mean rep max seed
2 Uneven replication rep 199 40 1 4.97 20 242
======= VARIANCE OF G ======
tf.Tensor([0.99999088 0.99905397 0.95536713], shape=(3,), dtype=float64)
case case label submethod training time (s) RMSE NRMSE 95% PI coverage 95% PI width DSS
2 Uneven replication rep 2.67 0.03 0.05 0.96 0.09 -19.76
case case label submethod lengthscales noise std fitted
2 Uneven replication rep [[0.19], [0.28], [0.25]] [0.04, 0.07, 0.09]
_images/5e9e844b143b1a97ab10e7ef332ca0aea003022bf42e07d95150e13d8be68848.png _images/5c4077faa06073e484e2e3eaae3e998e154ea4b4cd0dde96847a586580b50761.png

Saved figures to results_figure_jupyterbook/case_2_rep/.

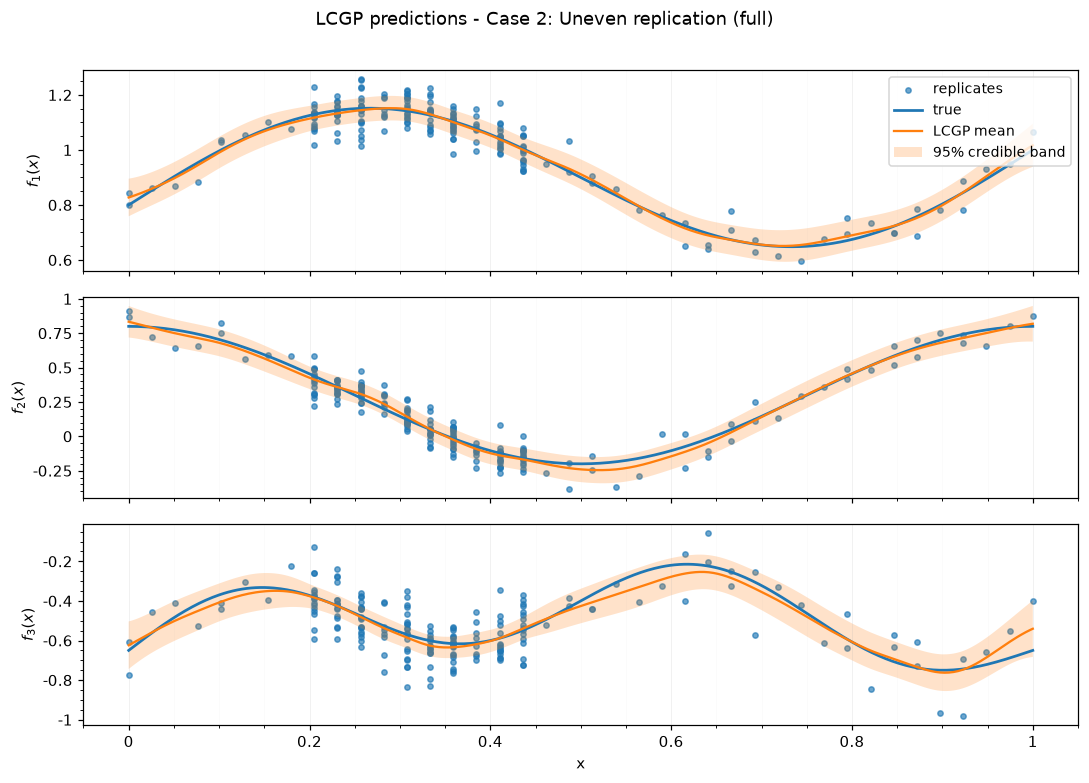
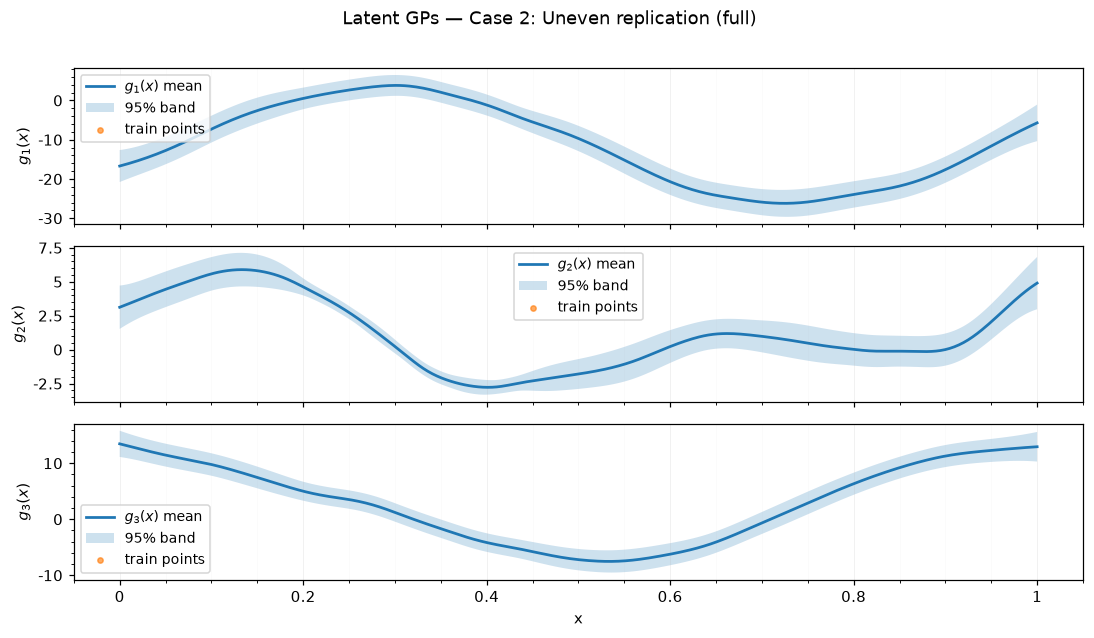
Case 2: Uneven replication — full

case case label submethod N total unique x rep min rep mean rep max seed
2 Uneven replication full 198 40 1 4.95 20 243
======= VARIANCE OF G ======
tf.Tensor([0.92479125 0.99611432 0.98610819], shape=(3,), dtype=float64)
case case label submethod training time (s) RMSE NRMSE 95% PI coverage 95% PI width DSS
2 Uneven replication full 9.46 0.02 0.04 1 0.15 -18.87
case case label submethod lengthscales noise std fitted
2 Uneven replication full [[0.27], [0.13], [0.38]] [0.73, 0.31, 0.96]
_images/16ea6a4cbb280ed4da9c650acdab73be993dd219d3a5f595fd42cc43d74323ba.png _images/3b56ad6a7b6935ee4116776290be54d28290902e35241aa5eb7d660cc2a043d3.png

Saved figures to results_figure_jupyterbook/case_2_full/.

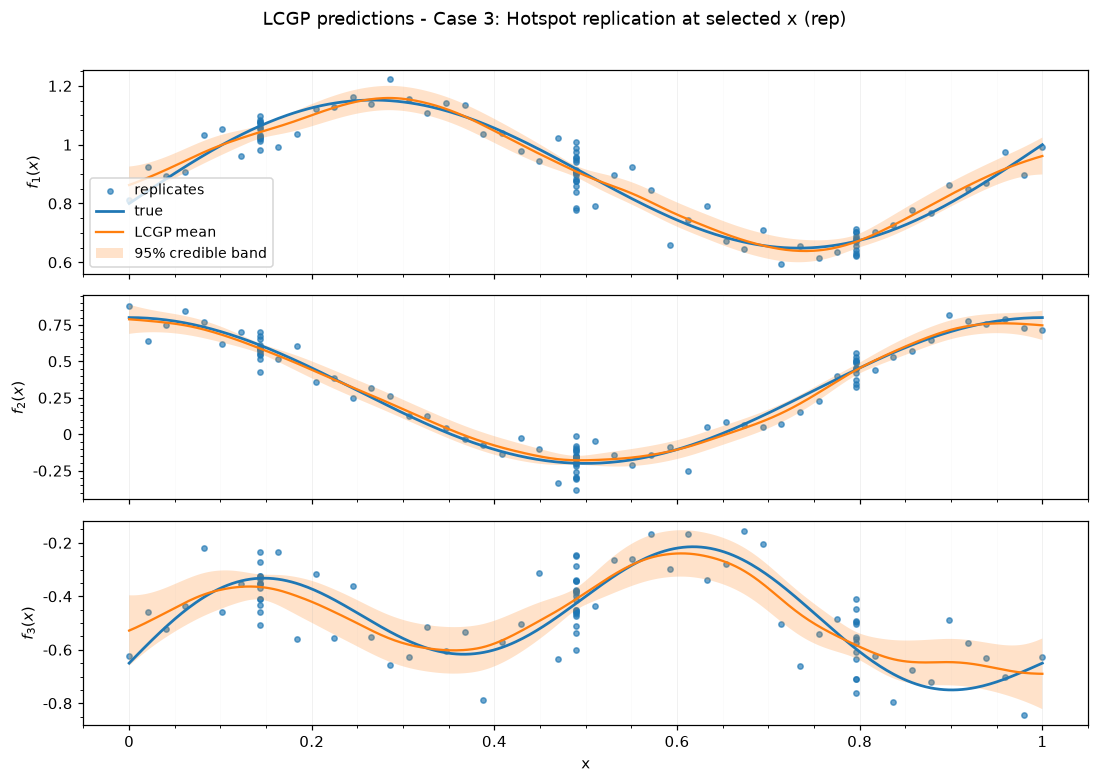
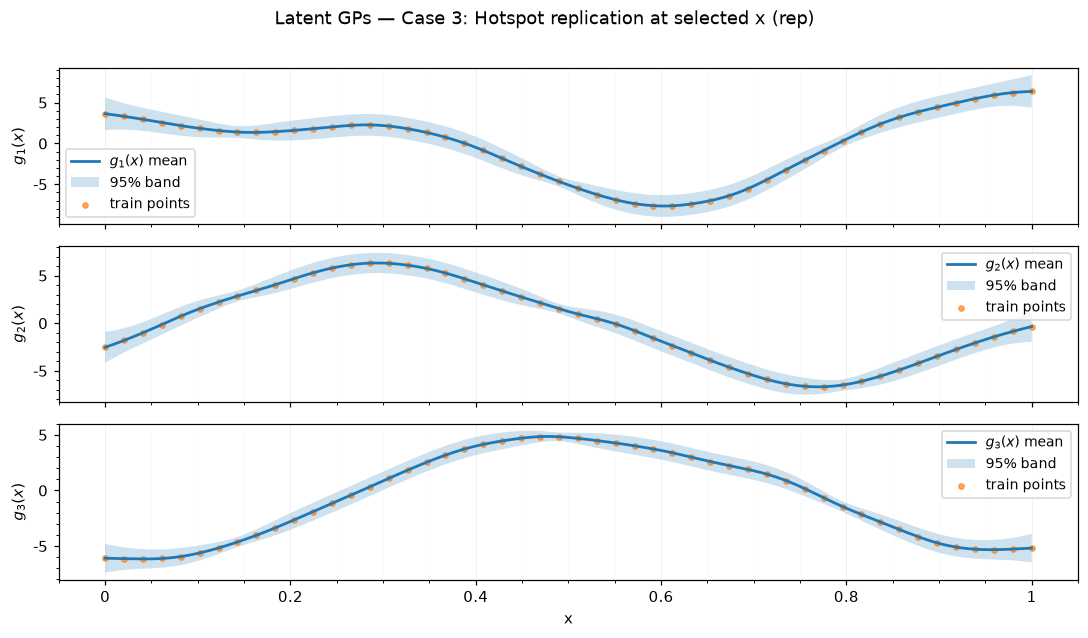
Case 3: Hotspot replication at selected x — rep

case case label submethod N total unique x rep min rep mean rep max seed
3 Hotspot replication at selected x rep 96 50 1 1.92 21 342
======= VARIANCE OF G ======
tf.Tensor([0.98413068 0.99982956 0.94817331], shape=(3,), dtype=float64)
case case label submethod training time (s) RMSE NRMSE 95% PI coverage 95% PI width DSS
3 Hotspot replication at selected x rep 2.19 0.03 0.05 0.97 0.12 -18.99
case case label submethod lengthscales noise std fitted
3 Hotspot replication at selected x rep [[0.18], [0.19], [0.25]] [0.05, 0.08, 0.11]
_images/a26d7872b5d29da845c93b46cf6ff40489a4f0d90d545bec25c5168baebcd44f.png _images/ccb789b8d043c6b848eba42791a4d8178363f84bcaab60b725f4d51d6fef1b36.png

Saved figures to results_figure_jupyterbook/case_3_rep/.

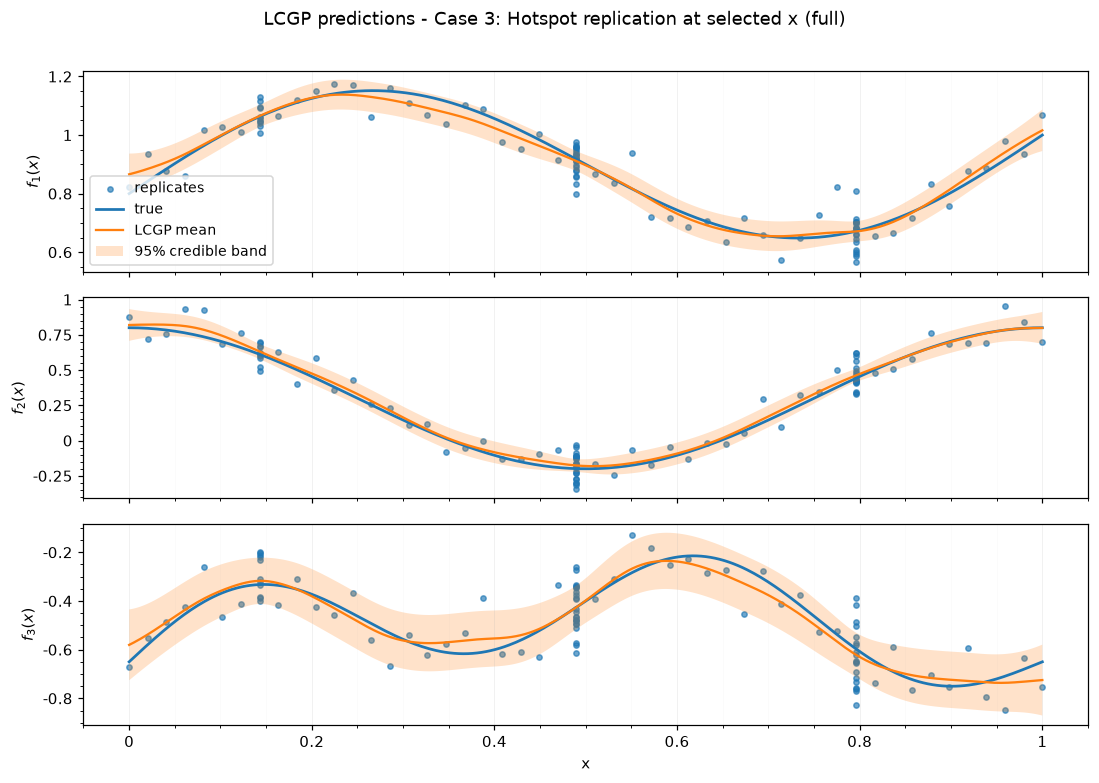
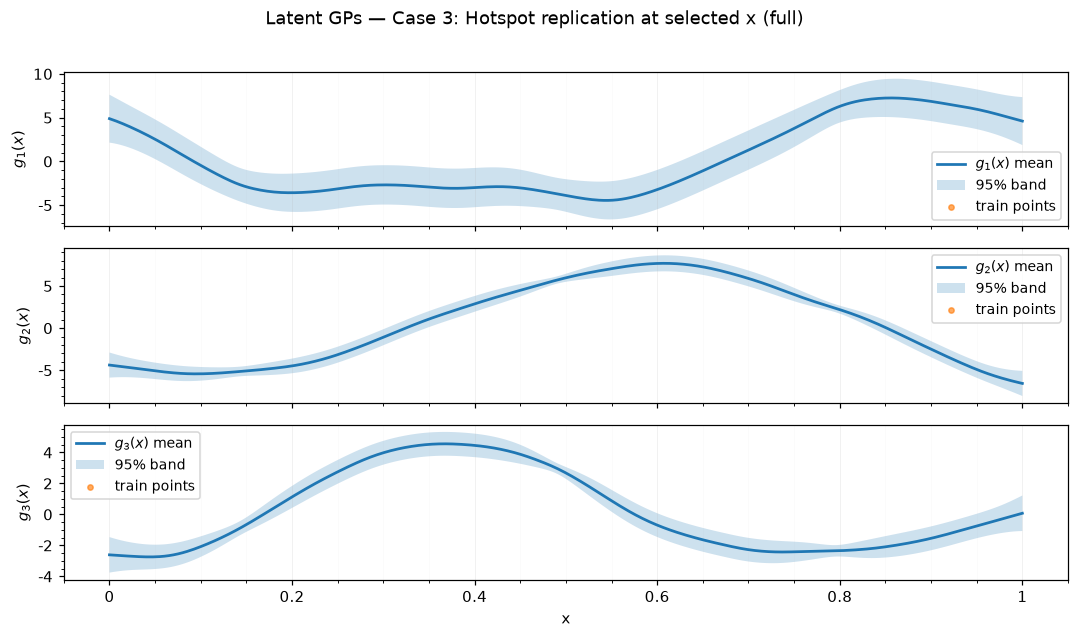
Case 3: Hotspot replication at selected x — full

case case label submethod N total unique x rep min rep mean rep max seed
3 Hotspot replication at selected x full 100 50 1 2 23 343
======= VARIANCE OF G ======
tf.Tensor([0.99379099 0.91915887 0.99517028], shape=(3,), dtype=float64)
case case label submethod training time (s) RMSE NRMSE 95% PI coverage 95% PI width DSS
3 Hotspot replication at selected x full 4.18 0.02 0.04 1 0.16 -18.56
case case label submethod lengthscales noise std fitted
3 Hotspot replication at selected x full [[0.14], [0.27], [0.16]] [0.33, 0.25, 0.65]
_images/26e2698a83235a722b7a8b1622660040d0902a4edb4c2efdea000dd9fc2a6e0d.png _images/d1fff223771bd79f8bdf6fa781d1a4f2e76ce248d1308dc63200c6047a52efc9.png

Saved figures to results_figure_jupyterbook/case_3_full/.

Summary tables#

replication_summary = pd.DataFrame(summary_rows)
metric_summary = pd.DataFrame(metric_rows)
diagnostic_summary = pd.DataFrame(diagnostic_rows)

display(Markdown("### Replication design summary"))
display_table(replication_summary)

display(Markdown("### Predictive performance summary"))
display_table(metric_summary.sort_values(["case", "submethod"]))

display(Markdown("### Fitted diagnostic summary"))
display_table(diagnostic_summary)

Replication design summary

case case label submethod N total unique x rep min rep mean rep max seed
1 Uniform replication rep 41 16 1 2.56 5 142
1 Uniform replication full 51 16 1 3.19 5 143
2 Uneven replication rep 199 40 1 4.97 20 242
2 Uneven replication full 198 40 1 4.95 20 243
3 Hotspot replication at selected x rep 96 50 1 1.92 21 342
3 Hotspot replication at selected x full 100 50 1 2 23 343

Predictive performance summary

case case label submethod training time (s) RMSE NRMSE 95% PI coverage 95% PI width DSS
1 Uniform replication full 3.01 0.03 0.06 0.97 0.18 -16.95
1 Uniform replication rep 5.19 0.04 0.07 1 0.23 -15.61
2 Uneven replication full 9.46 0.02 0.04 1 0.15 -18.87
2 Uneven replication rep 2.67 0.03 0.05 0.96 0.09 -19.76
3 Hotspot replication at selected x full 4.18 0.02 0.04 1 0.16 -18.56
3 Hotspot replication at selected x rep 2.19 0.03 0.05 0.97 0.12 -18.99

Fitted diagnostic summary

case case label submethod lengthscales noise std fitted
1 Uniform replication rep [[0.13], [0.21], [0.09]] [0, 0.01, 0]
1 Uniform replication full [[0.18], [0.21], [0.18]] [0.27, 0.22, 0.82]
2 Uneven replication rep [[0.19], [0.28], [0.25]] [0.04, 0.07, 0.09]
2 Uneven replication full [[0.27], [0.13], [0.38]] [0.73, 0.31, 0.96]
3 Hotspot replication at selected x rep [[0.18], [0.19], [0.25]] [0.05, 0.08, 0.11]
3 Hotspot replication at selected x full [[0.14], [0.27], [0.16]] [0.33, 0.25, 0.65]